Merry Christmas, everyone. I know I promised more on Fourier analysis, and I'll get to it, but I want to take a slight detour to mention some exciting results announced last week by the Cryogenic Dark Matter Search (CDMS), a dark matter experiment based on a different technology than my own. For the last decade, CDMS has been the leading experiment in the field, and their new result is no different. A week ago, CDMS released the results of their most recent analysis, and lo and behold! they had some events. This is exciting.
Before going forward, I'll just mention the methodology at work here. With some notable exceptions (like DAMA, for example), most dark matter experiments work by pushing down the backgrounds as much as possible to reveal the dark matter signal that may or may not be there. Therefore, the majority of work goes into understanding exactly how much background might be left over, with the goal to have "zero" background during the time the experiment is looking for WIMPs. It is generally impossible to have "zero" background - what is possible is a very small fractional expectation of a background. For example, CDMS expected 0.6 background events in their data set. What that means is they studied all possible sources of background using calibration sources and simulations and estimated that in the amount of time they looked for dark matter, on average they would see 0.6 background events.
When they looked at their data, they found 2 events. One can calculate the probability of having 2 background events given an expectation of 0.6, and CDMS has done this; they determined that there was about a 25% chance that the two events could be a fluctuation on the background, leaving a 75% chance that the 2 events were something new, like a dark matter interaction. This is not enough significance to claim a discovery (most physics experiments require a measurement with over a 99.999% chance of being something new before a discovery can be claimed), but it is exciting. Up until now, most experiments have never claimed to see something over background, so these results are a sign that there might actually be something to the last five years of my life. Of course, it's always possible CDMS underestimated their backgrounds.
As mentioned in the NYTimes article, we'll now wait with bated breath for the results from XENON100 in Italy, which should be the next experiment to get results. If the 2 events in the CDMS data are real dark matter events, XENON100 should be able to find out. And then my experiment should follow that up with our own search in a year or two. It's a good time to be involved in dark matter - who knows, maybe we'll figure out one of the biggest mysteries in physics from the last 70 years before the next presidential election.
Thursday, December 24, 2009
Saturday, November 7, 2009
Fourier analysis 2 - More complicated sound waves
I imagine the discussion in the previous entry seems pretty boring. It was really easy to tell apart the A note from the white noise, both by sound and by looking at the graphical representation. Things get more complicated however when we add more notes to make a chord or a complicated piece of music. For example, a simple A chord consists of three notes - A, C# and E. The nearest C# to the standard A has a frequency of 523.25 Hz while the nearest E has a frequency of 659.26. Here's what that sounds like on my guitar (it's sort of fun posting videos of my guitar online), followed by the graphical image:

One can still see the oscillatory behavior, but things aren't quite as clean as they were when I was plotting just the simple A note.
Now, what happens if I play a full A chord by adding A notes from the next two octaves up and another C# as well?

You can still see a few clear features, but overall it doesn't look nearly as obvious that this is an actual chord. In reality, no sound wave is perfectly free of noise either. We are all familiar with static in our speakers and acoustic reflections tend to add noise to the wave as well. In general, external sources of static add white noise on top of the underlying wave. In such a situation, it can be impossible to see the wave underneath the noise just by eye.
This is where Fourier analysis comes in. Fourier analysis is a mathematical method that can decompose signals like the ones shown in the various pictures into their constituent waves. By Fourier analyzing a pulse, we can find out how much of each pulse is contributed by a wave of a particular frequency. For example, returning to the simple A note, the entire pulse is a wave of 440 Hz. Therefore, the Fourier transform of that plot should provide us with a peak at 440 Hz, and nothing else. Here's what the Fourier transform of the A note looks like:

The Fourier transform has picked out the signal at 440 Hz, and shown that it is the only component there. What about white noise, where there is no dominant frequency component? Fourier analysis can find that as well.

And finally, where Fourier analysis really shines is when the signal is so complicated that one couldn't possibly tell apart all its constituents by eye. For example, look at the Fourier decomposition of the full A chord - all of the 6 notes are clearly broken out in the decomposition and we can understand exactly what went into the making of that sound.

I have one last example, just because I think this is so cool. I made a signal of 12 semi-random frequencies, with a little white noise added. The first plot is what they look like in the time domain (i.e. when you plot the amplitude of the sound as a function of time). There's no real pattern there that I can see. But when I plot the Fourier transform, there they all are. It's like magic. But it's not, it's just math, and I'll try to explain it qualitatively in the next post.


Fourier analysis 1 - Sound waves
First, I need to apologize for the lack of activity on this blog, and regretfully state that the relative dearth of new posts will likely continue for another few months. I'm at the point of my career when I try to graduate and get a job for next year, and between these two activities I don't have much time for posting to this blog. I do plan on continuing it, but it will of necessity be sporadic for a few more months.
Now that that is out of the way, I want to discuss Fourier analysis, which I mentioned at the end of the last post (over two months ago). One theme that may have come through to someone reading this blog since the beginning is the ubiquity of "waves" in physics. When discussing the Doppler effect back in March, I used sound as an example (the police siren) before moving to light. I want to do the same thing now. Sound is a pressure wave that moves through the air and is interpreted by our ears. Just as the color of light is determined by its frequency, the pitch of sound is also determined by the frequency of the sound wave. People who play music will be very familiar with this - the root A note, for example, is a sound wave with a frequency of 440 Hz (if I haven't used this unit before, a Hz is just inverse seconds. So 440 Hz means that the wave oscillates 440 times per second). Let's use the power of modern computers to show a video of me playing the A on my guitar:
The idea here is fairly simple. The guitar is tuned so that plucking the string makes it oscillate at 440 Hz, creating the note that we hear.
On the opposite end of the spectrum from a perfectly pitched musical note is "white noise." We all know what white noise is, it's static, something with no discernable pattern. It's called white because the color white is a combination of all colors. White noise is a combination of all frequencies. For a lovely example of white noise, one can go to http://simplynoise.com/.
The point of this is that waves are very well understood mathematically. Therefore, we can very easily represent these sounds with a mathematical expression. For example, the A note I played in the video can be represented as an oscillating wave with frequency 440 Hz, and it would look something like the drawing to the right. There's clearly a pattern in there of the appropriate frequency (I also added an overall envelope to describe the starting and stopping of the pulse, but that's not really important for this discussion).
White noise looks like the next plot, and there is no pattern there.
In part 2, I'll talk about what happens when you add more tones to form a chord (or an orchestra) or what happens when you add noise to a tone.
Now that that is out of the way, I want to discuss Fourier analysis, which I mentioned at the end of the last post (over two months ago). One theme that may have come through to someone reading this blog since the beginning is the ubiquity of "waves" in physics. When discussing the Doppler effect back in March, I used sound as an example (the police siren) before moving to light. I want to do the same thing now. Sound is a pressure wave that moves through the air and is interpreted by our ears. Just as the color of light is determined by its frequency, the pitch of sound is also determined by the frequency of the sound wave. People who play music will be very familiar with this - the root A note, for example, is a sound wave with a frequency of 440 Hz (if I haven't used this unit before, a Hz is just inverse seconds. So 440 Hz means that the wave oscillates 440 times per second). Let's use the power of modern computers to show a video of me playing the A on my guitar:
The idea here is fairly simple. The guitar is tuned so that plucking the string makes it oscillate at 440 Hz, creating the note that we hear.
On the opposite end of the spectrum from a perfectly pitched musical note is "white noise." We all know what white noise is, it's static, something with no discernable pattern. It's called white because the color white is a combination of all colors. White noise is a combination of all frequencies. For a lovely example of white noise, one can go to http://simplynoise.com/.
The point of this is that waves are very well understood mathematically. Therefore, we can very easily represent these sounds with a mathematical expression. For example, the A note I played in the video can be represented as an oscillating wave with frequency 440 Hz, and it
 would look something like the drawing to the right. There's clearly a pattern in there of the appropriate frequency (I also added an overall envelope to describe the starting and stopping of the pulse, but that's not really important for this discussion).
White noise looks like
 the next plot, and there is no pattern there.
In part 2, I'll talk about what happens when you add more tones to form a chord (or an orchestra) or what happens when you add noise to a tone.
Wednesday, August 26, 2009
Gravitational potential wells (final)
In the last post, I compared the early universe to a mattress with a number of bowling balls on it, creating divots for matter to fall in and out of. I have to admit that it isn't the best analogy; the behavior I'm trying to describe is relatively universal, however. Imagine a really great vacation spot - initially, people will be attracted to this spot. As more and more people visit it, the pressure of all those people mean that it's no longer an attractive location and they stop coming. Also not a good analogy.
In the end, the point is that local density fluctuations created sources of oscillation. Matter was attracted to regions of high density and fell into the well, before photon pressure became too great and pushed it back out. The final piece of information we need before we can finish this particular section is that regions of high density are hotter than regions of low density. And as we already know, the temperature or energy of a photon is related to its wavelength. Therefore, a photon coming from a region of high density is "hotter" or has a higher frequency than a photon coming from a region of low density. This is how the CMB tells us about the early universe. By looking at the temperature fluctuations of the CMB, we can understand the density fluctuations in the early universe.
To once again plagiarize Wayne Hu's website, he has an expanded version of the movie in the previous post. Here, there are two potential wells with a hill in the middle. When the balls are at the bottom of the well, the temperature is hotter and photons departing at that time are correspondingly hotter. When the balls are not in the well, things are colder and the photons reflect it accordingly (I believe in this movie, hotter is represented by blue and colder by red, since blue light has more energy than red light). By detecting these photons we now know about how uniform the early universe was and we can make conclusions about the distribution of matter and energy. In the next post, I'll start talking about how we decode these photons using Fourier analysis.
Saturday, August 8, 2009
Gravitational potential wells (part 2)
In the last post I described gravity as the curvature of space, creating little wells for other masses to fall into. This is the image we want to think about as we imagine the early universe. At that time, the structure we see in the universe today hadn't formed yet - there were no planets, galaxies or clusters of galaxies. Instead, there were small perturbations, small potential wells that contained the seeds of future galaxies. Returning to the image of a bowling ball on a mattress, we can imagine a giant mattress with many small little bowling balls on it. These bowling balls were placed at random, simply because nothing is perfectly smooth. In addition to the bowling balls, there are countless smaller marbles moving at random across the surface of the mattress. None of the bowling balls was very large, but they did create small little divots for the little marbles to fall into or orbit around or bounce in and out.
This isn't the whole picture though. Over a month ago, I described the thermal equilibrium of the early universe, where everything was reacting with everything else, atoms were ionized and electrons were constantly interacting with photons. There was a lot of energy involved in those reactions. In particular, this energy was enough to keep the marbles from settling down in the divots. If too many marbles gathered in a particular place, the pressure caused by all the photons bouncing around tended to push the marbles apart. In this way, a situation very much like the pendulum on the spring was created. The marbles were attracted to the wells created by the bowling balls, but when they tried to reach the center, there was enough energy to push them back out. Once out, they were again attracted to the bottom of the well, and therefore we have an oscillation.
I've taken a nice illustration from University of Chicago Professor Wayne Hu's website. In this movie, the well is caused by the random gravitational fluctuations, or the bowling balls. The marbles are represented by the yellow balls, and the pressure caused by all the photons is represented by the springs, pushing the marbles apart when they get too close to the bottom of the well.
Gravitational potential wells
I've changed my mind on how I want to proceed with the CMB. I had a post starting to talk about general relativity, but I've decided that it is too much for this particular sequence. I'd want to really talk about special relativity and general relativity to really do it justice, therefore I've decided to skip it for now. However, that still leaves us needing to understand just what is the information encoded in the Cosmic Microwave Background, so I'll try to do a slightly different description.
Imagine a pendulum - like this one!
The pendulum oscillates back and forth, and as it does so, it traces out a well. The pendulum wants to rest at the bott om of the well, but it has too much energy, and so it continuously overshoots the bottom. The well looks like the line drawn in the still picture to the right. In physics, something like this is known as a potential well - the force of gravity is pulling the weight downward, towards the bottom of the well, but because of the string, the pendulum just bobs up and down in the well.
There are a surprising number of situations like this, and most gravitational interactions can be described in terms of potential wells. For example, the motion of the Earth around the Sun is an orbit that follows the same path as a pendulum in two dimensions. The Earth wants to go straight to the center of the Sun, just like the ball wants to rest at the bottom of the well; instead, the Earth goes around the Sun forever, unable to reach the middle (thankfully).
General relativity is a theory of gravity. Why does gravity create these potential wells? The answer can be thought of in terms of curvature. Large masses tend to curve the space around them, so that other masses will fall in towards the large one. In this framework, one can imagine the Sun as a giant bowling ball on a very smooth mattress. The mattress dips because of the mass of the Sun, and so the space around the Sun curves. Now, one can imagine rolling a bunch of marbles around the divot left by the Sun; if there were no friction, those marbles could roll around the Sun forever in an orbit, just like the planets.
In this sense, then, mass will curve the space around it to attract other masses. But those masses won't necessarily just fall straight in (although that can happen), but can oscillate, much as the Earth oscillates around the Sun, or as the pendulum above keeps going back and forth.
Imagine a pendulum - like this one!
The pendulum oscillates back and forth, and as it does so, it traces out a well. The pendulum wants to rest at the bott
 om of the well, but it has too much energy, and so it continuously overshoots the bottom. The well looks like the line drawn in the still picture to the right. In physics, something like this is known as a potential well - the force of gravity is pulling the weight downward, towards the bottom of the well, but because of the string, the pendulum just bobs up and down in the well.
There are a surprising number of situations like this, and most gravitational interactions can be described in terms of potential wells. For example, the motion of the Earth around the Sun is an orbit that follows the same path as a pendulum in two dimensions. The Earth wants to go straight to the center of the Sun, just like the ball wants to rest at the bottom of the well; instead, the Earth goes around the Sun forever, unable to reach the middle (thankfully).
General relativity is a theory of gravity. Why does gravity create these potential wells? The answer can be thought of in terms of curvature. Large masses tend to curve the space around them, so that other masses will fall in towards the large one. In this framework, one can imagine the Sun as a giant bowling ball on a very smooth mattress. The mattress dips because of the mass of the Sun, and so the space around the Sun curves. Now, one can imagine rolling a bunch of marbles around the divot left by the Sun; if there were no friction, those marbles could roll around the Sun forever in an orbit, just like the planets.
In this sense, then, mass will curve the space around it to attract other masses. But those masses won't necessarily just fall straight in (although that can happen), but can oscillate, much as the Earth oscillates around the Sun, or as the pendulum above keeps going back and forth.
Sunday, July 12, 2009
CMB Anisotropies (part 2)
 The Dipole
The above picture is an image of the temperature variation in the CMB with the contrast turned up to 1 part in 1000. Therefore, there is about 0.1% difference between the left side and the right side. This particular pattern appears fairly often in physics and is known as a dipole (there are two "poles" where the temperature is hotter or colder and the rest of the distribution stems from those two centers). Why is there such a distinct pattern in the temperature distribution?
The answer lies in the Doppler effect, which we've talked about at length before. In fact, we've talked about everything we need to explain this pattern. I've mentioned that the temperature is similar to the energy, so that we're effectively showing the energy of the CMB photons as a function of where they are coming from. And we know that the energy of a photon is related to its frequency. Therefore, the above picture shows the change in frequency of photons coming from one direction or another. We know that galaxies rotate, including our own. And finally, we know from the Doppler effect that the relative velocities of a source and an observer can change the observed frequency of light.
Mom, can you now guess why this pattern looks the way it does (I'm not sure how I feel about directly addressing anyone in this blog, since there's clearly no possibility of a direct response, but I'll leave it for now)? If you guessed that the Earth's motion through the galaxy resulted in a Doppler shift of the CMB photons depending on whether they are coming from in front of us or behind us, you would be exactly right. In effect, the Earth (and the Sun and the entire solar system) is moving towards one of those poles and away from the other, and thus we see the Doppler shifted dipole pattern shown above.
That is pretty interesting, but not revolutionary. We understand the Doppler effect and we know our galaxy is rotating, so if that were the only thing in the CMB anisotropy, it wouldn't be that big a deal. The real excitement (I keep pushing it forward, don't I?) arrives when we subtract the dipole effect (it's fully understood, so we can do that), leaving the smaller part in one hundred thousand variations.

Tiny variations
Finally (finally!), I will talk about what the CMB is showing us. The above is a map with the contrast turned up to that part in 100,000. And now there's no obvious pattern, which is good, because the universe is supposed to look the same in all directions. Basically, these little fluctuations are the imprint of noise in the very early universe (remember, at one point I described the CMB as a snapshot of the universe at 400,000 years old). And by studying the distribution of this noise, we can infer things about the properties of the universe.
I plan on going into this in more detail (with a detour through something called Fourier analysis), but using the CMB, we can understand the age of the universe (13 and a half billion years), the geometry of the universe (flat), the amount of energy and density in the universe (the pie charts in the first post of this blog, including the 23% accounted for by dark matter [there is a connection between this and what I have been talking about until now, after all]), the rate of expansion of the universe, and other things. I think (and I hope you agree with me) that this is really impressive - this one measurement has answered several deeply fundamental cosmological questions about how the universe works all in one go, just by carefully studying the snow picked up by the rabbit ears on my mom's now useless analog television set.
Sunday, July 5, 2009
CMB Anisotropies (part 1: tricks with figures)
Now that we've had a week since the last post for us all to calm down about how exciting we found the giant map of pink representing the CMB and the implications that single color had for our understanding of the universe, I want to start talking about "anisotropy." Last week, I defined isotropy as meaning that everything looks the same in all directions. My mother, being a woman of letters, will immediately recognize that anisotropy must be the opposite - everything is not the same in all directions. In the last twenty years, it's been the anisotropy of the CMB that has really changed the physics world.
First, let's talk about the pink map one more time. What is actually being shown in that map is the temperature of the phot ons coming from that particular region of the sky (the map is elliptical because we are projecting a spherical surface [the sky around the earth] onto a flat space, much like flat maps of the globe are elliptical). The temperature is in this case a proxy for energy, and recall that the energy of a photon is related to its wavelength. Therefore, we can think of the pink map as showing the wavelengths of photons coming from different parts of the sky, and they all have about the same wavelength or temperature (about -270 degrees Celsius if you're interested).
Now, there's a subtlety here regarding contrast, because I never told you what the color actually represents in terms of temperature. If pink means any temperature between 0 and 4000 C, then no wonder the universe looks the same everywhere! To illustrate what I mean, I'm going to once again draw some of my own really high quality images. I have a gas stove in my apartment with 4 burners. When I turn those burners on, there are four hot spots on my stove. Let's assume the main part of the stove always stays at room temperature (70 degrees Fahrenheit or 21 C). Let's further assume that the temperature in the flame of my burners is 3500 F or 2500 C. I can represent this graphically in two different ways:


In the plot to the left, I've used a reasonable contrast, and we can clearly see the white that represents the room temperature part of the stove and the red that represents the hot part. But in the plot to the right, I've used such a big scale (or a small contrast), that the stove looks the same color, just like the map of the CMB.
Hopefully, you're now all asking the question, "so just how isotropic is the CMB?" since I can apparently make a plot that looks uniform just by changing the scale. The answer is that it is very isotropic, but not perfectly. The pink map is accurate up to 1 part in 1000. Basically, all the photons have the same temperature to within 0.1%. Which is pretty uniform. But, suppose we turned up the contrast, so that colors varied with that 0.1% (this would be analogous to switching from the right plot to the left). Now the CMB looks like this:

What about if we went even further, to a contrast of 1 part in 100,000 (this would be like looking for the difference between adding or subtracting a penny from 1,000 dollars)? Here is where the excitement really enters, but I'll talk about that in the next post (CMB plots courtesy of the WMAP homepage, as usual).
First, let's talk about the pink map one more time. What is actually being shown in that map is the temperature of the phot
 ons coming from that particular region of the sky (the map is elliptical because we are projecting a spherical surface [the sky around the earth] onto a flat space, much like flat maps of the globe are elliptical). The temperature is in this case a proxy for energy, and recall that the energy of a photon is related to its wavelength. Therefore, we can think of the pink map as showing the wavelengths of photons coming from different parts of the sky, and they all have about the same wavelength or temperature (about -270 degrees Celsius if you're interested).
Now, there's a subtlety here regarding contrast, because I never told you what the color actually represents in terms of temperature. If pink means any temperature between 0 and 4000 C, then no wonder the universe looks the same everywhere! To illustrate what I mean, I'm going to once again draw some of my own really high quality images. I have a gas stove in my apartment with 4 burners. When I turn those burners on, there are four hot spots on my stove. Let's assume the main part of the stove always stays at room temperature (70 degrees Fahrenheit or 21 C). Let's further assume that the temperature in the flame of my burners is 3500 F or 2500 C. I can represent this graphically in two different ways:


In the plot to the left, I've used a reasonable contrast, and we can clearly see the white that represents the room temperature part of the stove and the red that represents the hot part. But in the plot to the right, I've used such a big scale (or a small contrast), that the stove looks the same color, just like the map of the CMB.
Hopefully, you're now all asking the question, "so just how isotropic is the CMB?" since I can apparently make a plot that looks uniform just by changing the scale. The answer is that it is very isotropic, but not perfectly. The pink map is accurate up to 1 part in 1000. Basically, all the photons have the same temperature to within 0.1%. Which is pretty uniform. But, suppose we turned up the contrast, so that colors varied with that 0.1% (this would be analogous to switching from the right plot to the left). Now the CMB looks like this:

What about if we went even further, to a contrast of 1 part in 100,000 (this would be like looking for the difference between adding or subtracting a penny from 1,000 dollars)? Here is where the excitement really enters, but I'll talk about that in the next post (CMB plots courtesy of the WMAP homepage, as usual).

Sunday, June 28, 2009
The Cosmological Principle
The definition of cosmology is the study of the structure and evolution of the universe. In modern physics, cosmology begins with the application of Einstein's theory of gravity, or General Relativity (recall this post), to the universe. This is a difficult task and would probably not be possible without a basic assumption about the universe - that it is spatially homogeneous and isotropic on large scales. Isotropy is a statement that the universe is the same in all directions (the universe looks the same whether you are looking directly outward from the North Pole or the South Pole). Homogeneity contends that the universe is the same at all points. These two hypotheses are together known as the "cosmological principle," without which much of our presumed understanding of the workings of the universe would be invalid.
Over short scales, this is obviously not true. Looking at the Milky Way is clearly different from looking at other parts of the sky. This makes it hard to test the hypotheses, as we need to go to larger and larger length scales to really see this principle in action, by averaging large volumes (using painting again as an example, imagine a canvas entirely of one color. Up close, you can see individual brush strokes with a great variation from place to place. From far away, though, one section of the canvas looks much like any other section, as they are all one color. Our universe is like that, if you believe the cosmological principle) .

Viewed in that context (I originally wrote "viewed in that light" but didn't want anyone to think I was making a pun), this rather boring picture of the CMB (taken from the COBE satellite in the early 1990s) becomes much more exciting - as already discussed, the CMB photons are coming from all corners of the universe. And they all look exactly alike (to 1 part in 100,000)! The first measurement of the very smooth spectrum of the CMB provided strong supporting evidence to the foundational hypothesis of cosmology, as the universe truly does look the same in all directions (it's slightly harder to convince yourself of homogeneity, that the universe looks the same at every point, but Copernicus can help here - if we proceed under the conservative assumption [although perhaps contentious from a religious point of view] that we do not live in a particularly special place in the universe [the "Copernican principle"], we can conclude that since the universe is isotropic around us, it should be isotropic everywhere. This implies homogeneity).
The Horizon Problem
Of course, that is not the entire story. I will briefly discuss the "horizon problem" here, before talking about the "anisotropies" in the CMB in later posts (these are the 1 part in 100,000 fluctuations that you can't see in the above picture because they are too small). We've decided the universe looks the same in all directions (the left side of the picture is the same color pink as the right side of the picture). But is the entire universe in causal contact?
My mom might ask, "what does causal contact mean?" If two events in space and time can be caused by the same preceding event, they are in causal contact. Here on earth, this is generally understood in terms of time. If something happens after something else (say, for example, I get a book out of the library because my mother recommended it), there can be a causal relationship (I got the book because my mom recommended it). On the other hand, if things are happening at the same time, they can't be causal (if my mom's recommendation comes at the exact moment I'm getting the book [or after I do so], she clearly can't be the cause of my literary enjoyment).
On universal scales, things are slightly complicated by the finite speed of light which adds a dimension of distance to the picture. We all know that the speed of light is constant, but for most of us, this doesn't really mean anything. We turn on a light switch, and the light turns on immediately. That is because the speed of light is so fast that we don't notice the time it took for the information to travel down the wire to the light bulb and back to our eyes. In space, however, this is not the case. For example, it takes about 8 minutes for light from the Sun to reach us. That means that an event in the Sun can only cause a response on Earth 8 minutes later. Suppose there were explosion in the Sun followed by an explosion on Earth 4 minutes later. The Sun's explosion cannot be the cause of the one on Earth, because any information from the Sun cannot reach us in less than 8 minutes (of course, both explosions could have been caused by some event happening in between, but hopefully the idea is clear).
This gives rise to the horizon problem. We know roughly how old the universe is and we know the speed of light. That means we know how far light can have traveled since the "epoch of last scattering." The problem is that the far right side of the pink ellipse is too far away from the far left side of the pink ellipse to have been in causal contact. Imagine running time backwards and following a photon emitted from both edges directed towards the center. At the time of last scattering, those photons would not have reached the center yet. In other words, what is happening on the left side and what is happening on the right side could not possibly have been caused by the same thing. Yet, they clearly look the same. How is this possible, when they could not have been influenced by the same initial conditions? This is the horizon problem, because the two extremes are outside of each other's causality horizon.
There are some theories on how to solve the horizon problem (with the leading candidate being "inflation") but they are probably beyond the scope of this blog (an argument can be made that the CMB is beyond the scope of this blog, but I hope my loyal reader(s) ignores that argument).
Tuesday, June 16, 2009
Some history
In the 1940s and 50s, a few scientists (George Gamow, Ralph Alpher and Robert Herman among others) predicted the continued existence of the photons that last scattered in the very early universe. Theoretically, those photons had continued to travel through the universe, cooling as the universe expanded. The early theorists tried to predict what the temperature of these photons would now be (with varying degrees of success). These photons should be all over the place and hence providing a constant "background" to any antenna on earth. In addition, they should have cooled enough that now their wavelength would be in the microwave range. Thus, these photons came to be called the cosmic microwave background.
In the mid 1960s, a group at Princeton led by Robert Dicke began building a radiometer to detect the CMB. At the same time, Arno Penzias and Robert Wilson at Bell Labs observed some noise in a sensitive antenna they were planning to use for radio observation. After careful work, they decided that this noise had to be external and coming from all directions in the sky. Eventually they made contact with the Princeton group, and this background noise was interpreted as being the CMB (after first talking to Penzias and Wilson, Dicke supposedly got off the phone and told his collaborators, "Boys, we've been scooped"). The two groups published companion papers on the observation and the interpretation, and in 1978 Penzias and Wilson received the Nobel Prize.
Although important, that first observation is not on its face all that exciting. The CMB is remarkably smooth or isotropic (meaning it looks the same in all directions). The picture below shows what Penzias and Wilson might have seen if they'd been able to observe the CMB in all directions (courtesy http://map.gsfc.nasa.gov/), and it's hard to see what all the fuss is about. But I'll leave that for the next post.

Thermal equilibrium recap
The last post is rather long and involved, so I will try and recap in briefer terms. The early universe was very hot, so that everything was in thermal equilibrium. In particular, because reactions were constantly taking place, the universe was strongly "ionized" or charged. Therefore, photons were constantly scattering off the charged particles.
Eventually the universe began expanding and cooling.* As it did so, the ions and free electrons "recombined" (during the time romantically referred to as the era or epoch of recombination) to form neutral atoms, after which photons no longer scattered (romantically referred to as the "surface of last scattering," a phrase that always puts me in mind [for whatever reason] of the "Last Homely House" in the Lord of the Rings [yes, I am a physicist and I love Tolkein and I write a blog for my mom]). Those photons remain unmolested since that time.
*Aside: my mom asks in a comment "why did the universe cool?" The short answer to that is because it expanded. Temperature is in some sense a measure of how many collisions occur in a space [recall my analogy about money in the last post] - at high temperature, there are lots of collisions. Suppose we expanded the space, but kept the number of particles the same. All of a sudden, the number of collisions would go down, because the particles wouldn't be able to find each other to collide. Therefore the temperature drops. Many [if not all] refrigerators operate this way, by allowing a compressed gas to expand rapidly and thereby drop in temperature. A follow-up question is then "why did the universe expand?" and I have a less satisfactory answer to that. My best explanation is that there was a lot of energy released in the big bang, and it was that energy that drove the expansion. We may have more to say on this subject at later times).
Sunday, June 7, 2009
Thermal equilibrium
Last week was graduation at Yale, and a few of my closest friends here were getting their degrees. As such, some celebrating ensued. One of my friends is now doing post-doctoral work at UCLA, while another is working for a financial firm outside of New York. One night we spent some time in the early morning hours discussing the economy and the stock market. In that discussion, I came up with a somewhat stilted metaphor that I'm now going to invert to describe the concept of thermal equilibrium, which is where I want to begin the series on the CMB. In physics, temperature plays a similar role to that of money (or liquidity) in the markets.
First, I'm going to define "ionization" by referring briefly to the Bohr model I described here. Ionization is the process by which an atom loses (or gains) an electron and becomes charged. In the old post, I compared an atom to a building with an elevator which could transfer people (or electrons) between discrete levels. Using that image, ionization would occur if the elevator dropped you off on the roof, at which point you could leave the building entirely. As long as you were within the building, you remained trapped, just as an electron remains trapped by the electric field of the protons at the center of the atom (or as the Earth is trapped by the gravitational field of the Sun). On the roof, however, you have gained enough energy that you can leave the building; if an electron gains enough energy, it can escape from the electric field and be free, leaving the atom positively charged. This positively (or negatively, if it picks up an electron) charged nucleus is referred to as an ion.
One more thing that we should keep in mind about charged particles is that they interact rather strongly with light (or photons, as faithful readers will remember that light is a particle called a photon). A photon traveling through a cloud of charged particles will scatter many times, so that the photon that appears on the other side of the cloud will have very little to do with the one that entered it.
I'll now switch gears completely to describe the relationship between temperature and money. Suppose my mother in her younger days was living in a rather small apartment in London. My mom is a rather accomplished amateur interior decorator, and we'll assume she had those skills in her flat in London. I'm going to go one step further and ascribe a fickle nature to my mother which I would like to emphasize for posterity that she does not in actuality possess; in my hypothetical situation, this invented nature of hers combined with her penchant for interior design led her to continually change her mind on how she wanted to decorate her small house.
Ok, now we'll add money. If my mom had a lot of money, she could indulge her ever-changing whims. One week she could go for ultra modern and the next for antiques. Basically, the furniture would be coming and going, styles would be in and out, her little flat would be in a constant state of flux. Suppose, however, that she suddenly lost all her money; my mother would be forced to pick the cheapest option with which to decorate her house and stick with it. While she may still desire a change, she would have to settle for the most practical option.
In the physics of chemical reactions, temperature is like money. If my mom has money, she can change her flat at will - she can bring in new stuff, get rid of the old stuff easily whenever she wants. If the temperature is very high, a chemical reaction can occur easily and can go in both directions. Specifically for the purposes of the CMB, at high temperatures atoms can easily lose electrons and become ionized, before quickly finding other electrons freed from other atoms to become neutral again. In the early universe, the temperature was very hot and this was happening all the time; the universe was a soup of charged particles and photons bouncing off each other constantly. In particular, the photons never went very far before hitting another charged particle.
However, when my mom no longer had any money, she was forced to pick the cheapest option and stick with it. Similarly, after the big bang the universe began expanding and cooling. As the temperature dropped, it was no longer so easy to ionize atoms. Eventually, the universe cooled enough that it dropped out of thermal equilibrium. That meant that all the atoms had to neutralize, because a neutral atom requires less energy than an ionized atom and free electron, and nature prefers to minimize the amount of energy in any system (just as my mom had to settle for the cheapest decor). Once the atoms were all neutral, any photons that were bouncing around no longer had to travel through a soup of charged particles. In effect, the photons that were produced just as the universe become neutral did not scatter again. These photons are still traveling through the universe and we can detect them now; they are the CMB. They still contain information from the last time they interacted with matter, which was 13 billion years ago, right when the universe became neutral.
Monday, June 1, 2009
Introduction to the Cosmic Microwave Background
The first series of posts contained one argument for the existence of dark matter. The response from my mother among others was tentatively positive, although most comments seemed to agree that I was perhaps going a bit too fast with the math and trying to pack too much in (my beloved sister has weighed in with a somewhat more negative opinion for which I thank her with all the fraternal feeling I can muster). I take the point that this blog may need more romance and less dry insistence, and I will attempt to respond accordingly.
Therefore, my next topic will be another argument for the existence of dark matter, and in my opinion one of the cooler phenomena in physics (I understand that my stating something is "cool" is not necessarily sufficient evidence, but I will try to explain) - the Cosmic Microwave Background or CMB for short (another good name, by the way).
In very broad strokes, the CMB is an echo or an image of the universe as it was 13 billion years ago (when it was only four hundred thousand years old - relative to the human lifespan, it's like we have a baby picture from when the universe was 1 day old). Much as archaeologists can learn about prehistoric epochs from fossils (or mosquitos trapped in amber) and geologists can infer the climate from ice cores that have been frozen for thousands of years, physicists can discover information about the contemporary contents and future evolution of the universe by studying the CMB.
So what is the CMB? It's a sea of light streaming across the universe in all directions that was produced 13 billion years ago and has not touched anything since that time. This light isn't visible to us, because its wavelength (remember these posts) is in the microwave band (i.e. too long to be visible by our eyes, but with enough intensity [thankfully not present in the actual CMB or else we'd all be in trouble], perfect for heating up instant hot chocolate [too quaint?]). It's always there though, and like a photograph, each individual photon contains an image of the universe shortly after the big bang.

The illustration (click for a bigger view) shows the history of the universe from the Big Bang to the present. The CMB is produced at the green and blue ellipse during the very early universe and detected in the present by the satellite labeled "WMAP."
I'll stop there for now, but hopefully the reader will want to know more. I'll probably refer to two web sites a great deal in the coming posts. The best existing CMB experiment is the Wilkinson Microwave Anisotropy Probe, or WMAP, and they have a great resource at http://map.gsfc.nasa.gov/ from which I've taken the illustration. The second web site is where I learned most of what I'll be talking about, the homepage of Professor Wayne Hu of the University of Chicago. He's done a great job explaining all the details and implications of the CMB in simple terms, and I hope to do half as good a job.
Baby blues

The aforementioned picture of me (narcissism being a commonly found flaw among physicists).
Friday, May 22, 2009
At the mine
I'm writing this entry from 6800 feet below ground. I am wearing a baby blue jumpsuit (pictures to come, hopefully), safety glasses, steel toed boots, a hair net and a har d hat. At some point, my mom commented that hearing about working in the mine might be more interesting than posts on physics, and so I am going to give the human interest piece a try.
I have been working up in Sudbury, Ontario for the past two and a half weeks at the underground lab I mentioned in the overview posts (linked from the right of this blog). What is it like? Well, it's pretty cool, I have to admit. Life at the lab is in many ways defined by the cage schedule of the mine, as I'll explain. I get up before 7, because I have to catch the 7:30 cage underground. If I miss that cage, I'm pretty sure that I won't be able to go under on that day. So, I'm up at 7 (I don't have to shower, as you'll soon see), drive to the mine, go to my locker. I take off the civvies, and put on a mining jumpsuit (lots of reflective tape), hardhat, glasses, wellington boots. I get my head lamp (there's a slot on the hard hat for the head lamp to slide into), tag in (the mine has a lot of safety rules, but the main one is the tag-in and tag-out system. If you go underground, you have to be tagged in, and then when you come back up you tag out.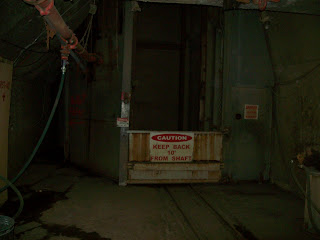 That way, when the company wants to do some blasting, they can make sure no one is underground. If you forget to tag out, or tag out the wrong person, they are not allowed to blast. People do get calls at 4 in the morning about being tagged in, you do not want to be the person who forgets) and wait for the cage. When it arrives, we all pile in. The cage is very cage-like. It's maybe 5 ft wide and 15 ft deep, made all of beat-up metal, and the miners and lab workers pile in in rows of 4. Sometimes, when it's full, we'll be squeezed all the way in, and I hear stories that "in the old days, we used to put 5 in a row." Then we drop. A couple of people will put their lights on at this point, otherwise we'd just be going down in the dark. We stop at a few places along the way for people to get off at various levels (if we stop too many times, that's known as a "milk run"), and then finally, we arrive at the 6800 ft level.
Next, we have to hike about 1.5 km down a drift. The drift is 10 ft wide maybe, with screen or "shotcrete" helping to support the walls. We'll hike half the way down, and then we call ahead to the lab where someone has advanced ahead of us with an air monitor (the modern version of a canary) to make sure it's safe to proceed. Sometimes there will be water on the ground to tramp through, and there's evidence of mining all over the place. Eventually we arrive at the lab. At this point, we take off our clothes, an
 d take the garbage bags off anything we've brought down with us. We shower (there's a built in shower every morning, which is nice when you're getting up so early [at least for a grad student]) and put on a clean jumpsuit and hair net, etc. The entire lab is a "clean room," which means that considerable effort has gone into making sure that all the dirt and dust picked up on the walk through the drift is cleaned off before we enter the lab. Hence the cleaning precautions.
So now we're in the lab. The walls are all whitewashed (but not straight, since it's a cave, essentially), and most of the ventilation and wiring is visible. It looks like the set of a sci-fi movie. So off I go to my experiment where I do the day's work (fiddling with high voltage power supplies, making sure the detector stays cold, that there is enough liquid nitrogen, doing various radioactive source calibrations, etc). Then, 45 minutes before the cage up time (again, there's a fixed schedule. I can't just come in and out whenever I want), we go through the reverse process, take off the lab clothes, put back on the mining gear, hike back out through the drift, etc. And you'd better make that cage.
So up we go back to the surface (there's a signal system for the cage, and you always know that when they signal 2 short pulses twice, the next stop is the surface), take off the mining gear, shower again (I love that the day is bracketed by showers), and voila, life underground at the lab.
It's a good thing I'm done this little summary, because a liquid nitrogen fill just completed so today's tasks are all done and the detector will survive the weekend, and I have to start cleaning up to catch the next cage out (I'm taking the early cage today).
 d hat. At some point, my mom commented that hearing about working in the mine might be more interesting than posts on physics, and so I am going to give the human interest piece a try.
I have been working up in Sudbury, Ontario for the past two and a half weeks at the underground lab I mentioned in the overview posts (linked from the right of this blog). What is it like? Well, it's pretty cool, I have to admit. Life at the lab is in many ways defined by the cage schedule of the mine, as I'll explain. I get up before 7, because I have to catch the 7:30 cage underground. If I miss that cage, I'm pretty sure that I won't be able to go under on that day. So, I'm up at 7 (I don't have to shower, as you'll soon see), drive to the mine, go to my locker. I take off the civvies, and put on a mining jumpsuit (lots of reflective tape), hardhat, glasses, wellington boots. I get my head lamp (there's a slot on the hard hat for the head lamp to slide into), tag in (the mine has a lot of safety rules, but the main one is the tag-in and tag-out system. If you go underground, you have to be tagged in, and then when you come back up you tag out.
 That way, when the company wants to do some blasting, they can make sure no one is underground. If you forget to tag out, or tag out the wrong person, they are not allowed to blast. People do get calls at 4 in the morning about being tagged in, you do not want to be the person who forgets) and wait for the cage. When it arrives, we all pile in. The cage is very cage-like. It's maybe 5 ft wide and 15 ft deep, made all of beat-up metal, and the miners and lab workers pile in in rows of 4. Sometimes, when it's full, we'll be squeezed all the way in, and I hear stories that "in the old days, we used to put 5 in a row." Then we drop. A couple of people will put their lights on at this point, otherwise we'd just be going down in the dark. We stop at a few places along the way for people to get off at various levels (if we stop too many times, that's known as a "milk run"), and then finally, we arrive at the 6800 ft level.
Next, we have to hike about
 1.5 km down a drift. The drift is 10 ft wide maybe, with screen or "shotcrete" helping to support the walls. We'll hike half the way down, and then we call ahead to the lab where someone has advanced ahead of us with an air monitor (the modern version of a canary) to make sure it's safe to proceed. Sometimes there will be water on the ground to tramp through, and there's evidence of mining all over the place. Eventually we arrive at the lab. At this point, we take off our clothes, an
 d take the garbage bags off anything we've brought down with us. We shower (there's a built in shower every morning, which is nice when you're getting up so early [at least for a grad student]) and put on a clean jumpsuit and hair net, etc. The entire lab is a "clean room," which means that considerable effort has gone into making sure that all the dirt and dust picked up on the walk through the drift is cleaned off before we enter the lab. Hence the cleaning precautions.
So now we're in the lab. The walls are all whitewashed (but not straight, since it's a cave, essentially), and most of the ventilation and wiring is visible. It looks like the set of a sci-fi movie. So off I go to my experiment where I do the day's work (fiddling with high voltage power supplies, making sure the detector stays cold, that there is enough liquid nitrogen, doing various radioactive source calibrations, etc). Then, 45 minutes before the cage up time (again, there's a fixed schedule. I can't just come in and out whenever I want), we go through the reverse process,
 take off the lab clothes, put back on the mining gear, hike back out through the drift, etc. And you'd better make that cage.
So up we go back to the surface (there's a signal system for the cage, and you always know that when they signal 2 short pulses twice, the next stop is the surface), take off the mining gear, shower again (I love that the day is bracketed by showers), and voila, life underground at the lab.
It's a good thing I'm done this little summary, because a liquid nitrogen fill just completed so today's tasks are all done and the detector will survive the weekend, and I have to start cleaning up to catch the next cage out (I'm taking the early cage today).

Saturday, May 16, 2009
More philosophical meanderings
My mom writes in a comment:
I think I would like to know what the consequences are of discovering or measuring dark matter. Also, does what you are doing have any relation whatsoever to things like the Hubble telescope or general space travel that people seem to be doing more and more of? Might your discoveries, for instance, give us an idea of the future of the universe as we know it?
xox MOM
These are good questions. What would be the consequences of discovering dark matter? When people ask me this question, one of the first things that I have to emphasize is that there are no foreseeable applications to my research. Nothing obviously useful will come out of it, unlike, for example, research in quantum computing or more applied fields. Now, there's always the chance that something we develop in trying to detect dark matter could be useful to society (for example, there are a number of ideas to use technologies developed in this field for detecting nuclear weapons at border crossings), but I believe that justifying this research by appealing to possible applications is dishonest.
The only reason I have for searching for dark matter is to increase our ("Mankind's" with a capital M) understanding of the universe. 23% of the universe is dark matter, and 85% of all the matter is dark. There are two aspects to this. The first is humanity's standard musings over "why are we here? how did we get here?" Dark matter is a key component to the evolution of the universe, influencing the expansion rate of the universe and the way matter first clustered to form stars and then planets. If it didn't exist in the way that it does, the Earth would probably not exist and neither would this blog. I'm touching up on religion again, here, which interestingly enough seems to happen quite a lot in this blog.
The second aspect that interests me is that I just think it's cool to know more about the way the universe works. Why is there more matter than antimatter in the universe (another great physics question, as naively we might expect identical amounts in which case we would have all disappeared in a puff of energy a long long time ago)? What was the big bang? Does dark matter really take the form we think it does (I sort of like the fact that we can predict the existence of a particle and then go out and find it, which has happened many times in the past)?
To answer my mom's other questions, this is very closely related to the Hubble telescope in the sense that a lot of the evidence for dark matter comes from telescopes like Hubble, and that telescopes have a chance to detect dark matter in a completely different way from us. Not so much space travel, which in my mind isn't so interesting.
The picture is a simulation of structure formation in the universe. All the filaments and bright sports are made of dark matter (Courtesy http://www.casca.ca/ecass/issues/1997-DS/West/ and interestingly enough titled "hugh.gif")
I think I would like to know what the consequences are of discovering or measuring dark matter. Also, does what you are doing have any relation whatsoever to things like the Hubble telescope or general space travel that people seem to be doing more and more of? Might your discoveries, for instance, give us an idea of the future of the universe as we know it?
xox MOM
These are good questions. What would be the consequences of discovering dark matter? When people ask me this question, one of the first things that I have to emphasize is that there are no foreseeable applications to my research. Nothing obviously useful will come out of it, unlike, for example, research in quantum computing or more applied fields. Now, there's always the chance that something we develop in trying to detect dark matter could be useful to society (for example, there are a number of ideas to use technologies developed in this field for detecting nuclear weapons at border crossings), but I believe that justifying this research by appealing to possible applications is dishonest.
The only reason I have for searching for dark matter is to increase our ("Mankind's" with a capital M) understanding of the universe. 23% of the universe is dark matter, and 85% of all the matter is dark. There are
 two aspects to this. The first is humanity's standard musings over "why are we here? how did we get here?" Dark matter is a key component to the evolution of the universe, influencing the expansion rate of the universe and the way matter first clustered to form stars and then planets. If it didn't exist in the way that it does, the Earth would probably not exist and neither would this blog. I'm touching up on religion again, here, which interestingly enough seems to happen quite a lot in this blog.
The second aspect that interests me is that I just think it's cool to know more about the way the universe works. Why is there more matter than antimatter in the universe (another great physics question, as naively we might expect identical amounts in which case we would have all disappeared in a puff of energy a long long time ago)? What was the big bang? Does dark matter really take the form we think it does (I sort of like the fact that we can predict the existence of a particle and then go out and find it, which has happened many times in the past)?
To answer my mom's other questions, this is very closely related to the Hubble telescope in the sense that a lot of the evidence for dark matter comes from telescopes like Hubble, and that telescopes have a chance to detect dark matter in a completely different way from us. Not so much space travel, which in my mind isn't so interesting.
The picture is a simulation of structure formation in the universe. All the filaments and bright sports are made of dark matter (Courtesy http://www.casca.ca/ecass/issues/1997-DS/West/ and interestingly enough titled "hugh.gif")
First summary
In the last post, I finally finished the first "thread" about galaxy rotation curves. My dad (who apparently also reads this blog, although not as consistently as my mom) wasn't quite sure how everything tied together (I believe he missed some entries in the middle). So to briefly recap: I started by explaining the Doppler effect, which was then followed by a series of posts on the wave/particle nature of light. I then discussed the Bohr model of the atom, because it provides a nice framework for understanding the emission of light by atoms. Combining all those posts, we can now understand how to measure the speed of rotation of a galaxy - hydrogen in stars emits light at known wavelengths/frequencies which are then shifted by the Doppler effect. Knowing the math behind the Doppler effect, we can determine how fast the galaxy is rotating. Next, we talked about Newtonian gravity, which led to a prediction for what we expect the rotation of galaxies to look like. In the last post, I described what we actually see, providing evidence for dark matter.
This is the goal of this blog - to try and describe all the pieces that go into a physics argument in a way that's understandable. My hope is that interested readers will see that while specific parts of physics may be esoteric or complicated (i.e. high level math), in a general sense we're making deductions in a way that is very similar to those made in almost any other field of study.
This is the goal of this blog - to try and describe all the pieces that go into a physics argument in a way that's understandable. My hope is that interested readers will see that while specific parts of physics may be esoteric or complicated (i.e. high level math), in a general sense we're making deductions in a way that is very similar to those made in almost any other field of study.
Monday, May 11, 2009
Galaxy rotation curves
Ok, so finally I think we can look at rotation curves. We'll make the simplifying assumption that the objects we are interested in are in a perfectly circular orbit about the center of the galaxy, an assumption which doesn't really change anything so it's ok (another larger point about physics: quite often [in fact, almost always], we take a complicated problem and approximate it into something smaller that we can solve [often called the "spherical cow" approach - we would approximate a cow to be a sphere and go from there]. The question then often becomes "how good was the approximation?" In this case, there is no real difference between circular and elliptical orbits, so the approximation is fine and the conclusions are valid).
We know the equation of circular motion, F=mv2/r. And by hypothesis, the only force acting on the object in orbit is the force of gravity, F=G*m1*m2/r2. In this case, m1 is the mass of the galaxy, and m2 is the mass of the object. We equate the forces, so mv2/r = G*m1*m2/r2. Now, the mass from the circular motion equation is just the mass of the object in orbit, so m2 will cancel. All that remains is to solve for the velocity, since that's what we measure using the Doppler effect and red shift.
m2*v2/r = G*m1*m2/r2
First, divide both sides by m2
v2/r = G*m1/r2
Next, multiply through by r
v2 = G*m1/r
Now, take the square root of both sides
v = Sqrt(G*m1/r)
And that's it. We have derived that the velocity of an object in orbit about a galaxy should be proportional to the square root of the mass of the galaxy divided by the orbital radius. There is one more thing we should be aware of, which is that I haven't made any assumptions yet about the size of the mass of the galaxy. A galaxy is a very large thing, and what happens if you're inside part of it? For example, the Sun and the Earth are somewhere inside the Milky Way galaxy. We do orbit the Milky Way center, but part of the Milky Way is outside our orbit. The answer is that in this case, m1 refers the total mass inside the orbit. It doesn't matter how spatially extended it is in space, as long as the object in which we're interested is outside of the galaxy, the equations are fine. And since I'm particularly interested in the mass of the bright part of the galaxy, it's easy to know when we're outside that part, so everything holds.
Now, let's look at a plot. If all the mass were in the bright part of the galaxy, then outside the bright part (say a radius of 100, just to make the plot look right), from the last equation, we would expect the velocity to fall like 1/Sqrt(r) (G and m1 would be constant). That would look like this:

Instead, we measure a flat line, like this:

Therefore, by deduction, we know that either Newtonian gravity is wrong (a possibility, I'll admit), or that there is more mass than we thought, mass that is not contained in the bright part of the galaxy. In fact, we know the distribution of that mass, as it has to increase like 1/Sqrt(r) or else the the velocity would not be flat.
This is what some of the actual data looks like:

These are measurements of galaxy rotation curves (Begeman, Broeils and Sanders, Mon. Not. R. astr. Soc., 1991, 249, 523). I apologize for the image quality, but velocity is on the y-axis and radius is on the x-axis, and all the black points are actual measurements. You can see at small radius the velocity increases. This is where the bright part of the galaxy is, and as the radius increases, we are containing more mass in the orbit. At larger radius, we would expect to see the velocity drop. But instead, it stays constant. The dashed and dotted lines are the the components of the mass, the bright part and the dark part. This data provides evidence that there is matter that we are not seeing, that is not interacting with light, but is dark matter.
Saturday, May 9, 2009
Newton's theory of gravity (part 2)
I have not posted (I can't quite bring myself to use "blogged" as a verb in the past tense, but I should probably get over such squeamishness) in almost a month now, for which I apologize. My excuses are standard - my work intruded. In the last month I have started looking at data from a new run and been to a conference (I've also been to my 10th high school reunion), and I am now visiting the mine in Canada I mentioned in one of the original posts to help run an experiment underground. Enough about my current activities, however, as it's time that I finally finished off the series on galactic rotation curves and Newtonian gravity. Unfortunately, I've realized that I still can't finish this in one post, but we'll get there eventually.
Mother, I'm sorry to say that we're going to need equations, but hopefully it won't be so bad. We'll start with Newton's Second Law of Motion, which says that F=ma. That's it. Force equals mass times acceleration. This law governs almost all macroscopic kinematics (a fancy word for the physics of motion). When you apply a force to something (say by pushing a book across a table), the book will accelerate with a particular acceleration depending on its mass. As with a lot of physics, this is intuitive, especially if we rewrite the equation as a=F/m. If I push a very light object, I can accelerate it rapidly (m is small, so the acceleration is big). If I try to push a heavy object like a car, I can barely move it at all (m is very large, so the acceleration is small). Likewise, the harder I push (more force), the faster it will accelerate.
Ok, next we'll look at circular motion where I'm presented with a pedagogical dilemma. Ultimately, I only really want the equation of circular motion (F=mv2/r), but I can't very well just state the equation without trying to explain it. I condescendingly fear, however, that any attempts at explaining it with a single paragraph in this blog will only result in confusion (which raises a question concerning the wisdom of the entire endeavor, but I'll ignore that). But here goes. In a circle, there are two important directions: the radial dire ction, which points from the center of the circle to a point on the circle itself, and the tangential direction, which is perpendicular to the radial direction. At any point on the circle, these directions have the same relationship to each other.
The key to circular motion (i.e. when an object just travels in a perfect circle forever and ever) is that the instantaneous velocity is always tangential to the circle while the acceleration is always radially inward. Imagine that my mother is on a ferris wheel. At point "A" on the ferris wheel, she is travelling straight to the left. At point "B" on the wheel, she is travelling straight down (for example, if she were to jump off the ferris wheel at that point, she would drop straight down). Likewise at points "C" and "D," she is travelling to the right and straight up, respectively. The point being that she is always moving tangentially and never radially.
The strange thing is that the force she experiences (the "centri petal force") is always radially inward. At this point, I think I may just have to revert to a "trust me." It's a matter of mathematical fact that to keep her motion circular, she must experience only radial forces. And if you work out the math, the necessary force is F=mv2/r; in other words, the force required to keep her in circular motion is proportional to the square of her velocity divided by the radius. This does make sense intuitively. The faster she is moving, the more force is required to get her to go around the circle. And, the larger the circle, the less change is required to keep her in orbit.
I'm very unsatisfied with that explanation, but I'll leave it for now. The final equation we need is Newton's equation of gravity. This is an empirical law (keeping in mind the discussion in the prior post). Newton discovered that two masses (call them m1 and m2) separated by a distance (call it r) will exert an attractive force on each other, F=G*m1*m2/r2, where G is a constant that is experimentally determined and set by nature. Every mass in the universe exerts such a force on every other mass and vice versa. However, the value of G is very small, so it takes either an extraordinarily large mass (like the Earth or the Sun) or an extremely small separation to observe this force. But that's all there is to Newtonian gravity.
Mother, I'm sorry to say that we're going to need equations, but hopefully it won't be so bad. We'll start with Newton's Second Law of Motion, which says that F=ma. That's it. Force equals mass times acceleration. This law governs almost all macroscopic kinematics (a fancy word for the physics of motion). When you apply a force to something (say by pushing a book across a table), the book will accelerate with a particular acceleration depending on its mass. As with a lot of physics, this is intuitive, especially if we rewrite the equation as a=F/m. If I push a very light object, I can accelerate it rapidly (m is small, so the acceleration is big). If I try to push a heavy object like a car, I can barely move it at all (m is very large, so the acceleration is small). Likewise, the harder I push (more force), the faster it will accelerate.
Ok, next we'll look at circular motion where I'm presented with a pedagogical dilemma. Ultimately, I only really want the equation of circular motion (F=mv2/r), but I can't very well just state the equation without trying to explain it. I condescendingly fear, however, that any attempts at explaining it with a single paragraph in this blog will only result in confusion (which raises a question concerning the wisdom of the entire endeavor, but I'll ignore that). But here goes. In a circle, there are two important directions: the radial dire
 ction, which points from the center of the circle to a point on the circle itself, and the tangential direction, which is perpendicular to the radial direction. At any point on the circle, these directions have the same relationship to each other.
The key to circular motion (i.e. when an object just travels in a perfect circle forever and ever) is that the instantaneous velocity is always tangential to the circle while the acceleration is always radially inward. Imagine that my mother is on a ferris wheel. At point "A" on the ferris wheel, she is travelling straight to the left. At point "B" on the wheel, she is travelling straight down (for example, if she were to jump off the ferris wheel at that point, she would drop straight down). Likewise at points "C" and "D," she is travelling to the right and straight up, respectively. The point being that she is always moving tangentially and never radially.
The strange thing is that the force she experiences (the "centri
 petal force") is always radially inward. At this point, I think I may just have to revert to a "trust me." It's a matter of mathematical fact that to keep her motion circular, she must experience only radial forces. And if you work out the math, the necessary force is F=mv2/r; in other words, the force required to keep her in circular motion is proportional to the square of her velocity divided by the radius. This does make sense intuitively. The faster she is moving, the more force is required to get her to go around the circle. And, the larger the circle, the less change is required to keep her in orbit.
I'm very unsatisfied with that explanation, but I'll leave it for now. The final equation we need is Newton's equation of gravity. This is an empirical law (keeping in mind the discussion in the prior post). Newton discovered that two masses (call them m1 and m2) separated by a distance (call it r) will exert an attractive force on each other, F=G*m1*m2/r2, where G is a constant that is experimentally determined and set by nature. Every mass in the universe exerts such a force on every other mass and vice versa. However, the value of G is very small, so it takes either an extraordinarily large mass (like the Earth or the Sun) or an extremely small separation to observe this force. But that's all there is to Newtonian gravity.
Tuesday, April 14, 2009
Newton's theory of gravity (part 1)
I fear that I got a bit ahead of myself at the end of the last post on the spectral lines of hydrogen. To fully close the circle between dark matter and everything I've been talking about in the last few entries, we do need to cover Newton's theory of gravity. Therefore, I will try to do so now, so that we can put this particularly sequence to rest.
First, on talking with a friend earlier today, I was asked, "I always hear the term "Newtonian gravity: is there any other kind?" This is exactly the kind of question I need to be asked, because otherwise I forget that I've been studying this stuff for 10 years. The answer is yes, there is another kind of gravity; more precisely, the answer is that there is a more complete form of gravity, namely Einstein's Theory of General Relativity (and possible string theory is a yet more complete form, although I'll leave that argument to Brian Greene's The Elegant Universe). Newton observed the effects of gravity and described those effects using math. However, he didn't describe how gravity works. To borrow an analogy directly from Greene's book, when my mom (and no, Greene didn't refer explicitly to my mom in his book [he did address himself directly to "you," but I don't think my mom has read it]) uses her computer, she doesn't know how it actually works (i.e. little electrical signals flashing through a chip). She only knows how to use it to write an article or to read this blog (sometimes she is unsure even how to do those tasks, at which times, coincidentally enough, she often checks in with her favorite son). Newton gave us a personal computer (gravity) and told us how to use it to write articles and check email (the equations), but he didn't tell us how it actually works (how is gravity transmitted, or how does the apple "know" it has to fall to the ground?).
In addition, Newton's formulation was only an approximation that was incorrect on certain scales (which are largely inaccessible to us and unobservable in our day to day lives). For example, I'll poach another commonly used illustration; from far away, a Seurat painting looks like a smooth picture. Newton's theory of gravity is accurate when viewed "from far away," which more or less is the point from which we all experience gravity. Up close, however, and all the dots become clear. While Newton got the big picture right, he did not describe the dots. General relativity can handle both the smooth "far away" view, but also the rough "up close" view.
 That's why we can talk about "Newtonian gravity." For all intents and purposes, we could just talk about gravity and we'd all be referring to Newton, but since this is a physics blog, I figure I should try to be more precise in my language. In the next post, I'll actually use Newton's equations to look at the rotation of galaxies.
The image of Seurat's Sunday Afternoon on the Island of La Grande Jatte was scanned by Mark Harden
First, on talking with a friend earlier today, I was asked, "I always hear the term "Newtonian gravity: is there any other kind?" This is exactly the kind of question I need to be asked, because otherwise I forget that I've been studying this stuff for 10 years. The answer is yes, there is another kind of gravity; more precisely, the answer is that there is a more complete form of gravity, namely Einstein's Theory of General Relativity (and possible string theory is a yet more complete form, although I'll leave that argument to Brian Greene's The Elegant Universe). Newton observed the effects of gravity and described those effects using math. However, he didn't describe how gravity works. To borrow an analogy directly from Greene's book, when my mom (and no, Greene didn't refer explicitly to my mom in his book [he did address himself directly to "you," but I don't think my mom has read it]) uses her computer, she doesn't know how it actually works (i.e. little electrical signals flashing through a chip). She only knows how to use it to write an article or to read this blog (sometimes she is unsure even how to do those tasks, at which times, coincidentally enough, she often checks in with her favorite son). Newton gave us a personal computer (gravity) and told us how to use it to write articles and check email (the equations), but he didn't tell us how it actually works (how is gravity transmitted, or how does the apple "know" it has to fall to the ground?).
In addition,
 Newton's formulation was only an approximation that was incorrect on certain scales (which are largely inaccessible to us and unobservable in our day to day lives). For example, I'll poach another commonly used illustration; from far away, a Seurat painting looks like a smooth picture. Newton's theory of gravity is accurate when viewed "from far away," which more or less is the point from which we all experience gravity. Up close, however, and all the dots become clear. While Newton got the big picture right, he did not describe the dots. General relativity can handle both the smooth "far away" view, but also the rough "up close" view. That's why we can talk about "Newtonian gravity." For all intents and purposes, we could just talk about gravity and we'd all be referring to Newton, but since this is a physics blog, I figure I should try to be more precise in my language. In the next post, I'll actually use Newton's equations to look at the rotation of galaxies.
The image of Seurat's Sunday Afternoon on the Island of La Grande Jatte was scanned by Mark Harden
Wednesday, April 8, 2009
Spectral analysis
As mentioned in the last post, the Bohr atom is not correct, quantum mechanically speaking. It does, however, do an excellent job in modeling the simplest atom, that of hydrogen. Hydrogen is the lightest element, consisting of one proton with one electron in orbit. With the Bohr atom model, we know that the orbiting electron can exist in various discrete orbits, corresponding to different energies. In addition, we know that when the electron jumps between these levels, it emits or absorbs a photon. Finally, we know that the energy of a photon is proportional to its frequency, which is related to its wavelength or color. Putting all this together, we can predict that a hydrogen atom will emit or absorb very specific colors of light.
We are now talking about "spectral analysis." The OED (do you like the use of the OED, mom?) defines spectrum in a couple of ways, but I'll print two of them here. First, a general definition for physicists: "An actual or notional arrangement of the component parts of any phenomenon according to frequency, energy, mass, or the like." Physicists often talk about an energy spectrum, a frequency spectrum, etc., and what we mean is exactly the definition given by the OED - breaking up some group or data set into its components.
A second definition is this: "The coloured band into which a beam of light is decomposed by means of a prism or diffraction grating. Also, a dark band containing bright lines produced similarly; such a (coloured or dark) band, or the pattern of lines in it, as characteristic of the light source; hence, the pattern of absorption or emission of light or other electromagnetic radiation over any range of wavelengths exhibited by a body or substance." Now this is exactly what I'm talking about. The general idea is familiar - anyone who has seen a rainbow has seen light broken up into its various colors. When applied to the hydrogen atom, the spectrum is the characteristic colors of light that can be emitted or absorbed. Using the Bohr model, we can predict which wavelengths can interact with hydrogen (this may be the subject of another quantitative post).

At right is an image of a tube filled with hydrogen that is being excited by high voltage (taken from here). The light passes through grating to separate the spectral lines, with the result being the smaller lines shown to the right. All hydrogen, anywhere in the universe, will emit these colors when excited.
And now we finally get back to dark matter. In the first post, I talked about how we can tell how fast the galaxies are spinning using redshift or the Doppler effect. That's because any hydrogen in those distant galaxies will have the same spectrum as hydrogen on Earth, which means the hydrogen in the distant galaxy is emitting the same wavelengths of light that we can measure here on Earth. As discussed in the Doppler effect posts, since light is a wave, its wavelength will be shifted via the Doppler effect depending on the speed of the source. Because we can measure the relationship between the different lines, we can use the observed shifts to deduce the rotational speed of the source galaxy (one side spins away from us, one side spins towards us). And voila, now we know that the galaxies are spinning too fast and that there must be matter we aren't seeing (well, we would see that if we understood Newtonian gravity, which will be the topic a future post, I'm sure).

The above plot taken from the website of an MIT experiment, FIRE, shows the redshift for three real objects. Why is it called "redshift?" Most objects in the universe are moving away from us, and when the source of light is moving away, the light shifts towards the red end of the spectrum (or towards lower energy).
Tuesday, March 31, 2009
The Bohr atom
In this post, I hope to describe the Bohr model of the atom. In the next post, I will use the Bohr model (together with the nature of light discussed in the last few posts) to predict the existence of "spectral lines," which will finally bring me back to dark matter by explaining exactly how we measure the speed of those rotating galaxies (see the Dark Matter Intro link at the right if this is not familiar). Historically speaking, I'm presenting this material backwards, as the observation of spectral lines came first and the explanation came later, but I will proceed anyway.
Niels Bohr is in many ways the father of quantum physics, if not its prime mover. He came of age before the revolutionary wave of the 1920s, but almost all of the physicists involved in developing quantum mechanics (Heisenberg, Dirac, Pauli to name a few) spent some time at the Institute of Theoretical Physics he founded in 1921. His model of the atom was a precursor to all of the discoveries of quantum physics to follow.
So what is that model? Although it turns out not to be accurate, it's a pretty good start, and I would guess that th e Bohr model is generally the picture most of us have in our minds for the atom today. Analogous to our picture of the solar system, the Bohr model imagines a dense, very small nucleus, surrounded by orbiting electrons (I took the picture from a website at Jefferson Lab).
By itself, that isn't all that interesting - the real theoretical interest of the Bohr atom was that the electrons are constrained to lie at specific orbits. In the solar system, the planets could theoretically lie at any radius - we could take the Earth, move it a little farther away from the sun, and it would still orbit contentedly (we might all be a bit colder, but the orbit would be fine). In Bohr's atom, an electron can't move to a slightly larger orbit; instead, it would have to jump to the next available orbit. The analogy is that the Earth can only be at our orbit or Mars' orbit, but nowhere in between.
To take this a step further, we can add energy considerations. The farther away from the nucleus, the more energy an electron has. Therefore, whenever an electron switches orbits, it gives up or takes in energy (depending on whether it's heading out or heading in). If it is only allowed to be in certain orbits, then the possible energy steps are discrete - it can only take in or give up a very specific amount of energy. For one more analogy, suppose my mom is on an elevator on the ground floor. If she goes up in the elevator, she can only get off on floors, she can't get off in between floors. And, as she goes up, she picks up a specific amount of energy (which she could give back if she were to jump out a window - she would be rather more regretful if she jumped out a 4th floor window as opposed to a 1st floor window because of all the energy she picked up by going up the elevator). The electrons in the orbit of the Bohr atom are like my mom on the elevator - they can't get off between floors and the amount of energy they can pick up or give out is discrete and fixed.
The very astute reader might see a similarity between this model and the photoelectric effect of Einstein from a few posts ago, when light could carry a specific and discrete amount of energy depending on its frequency. In fact, this is exactly the same thing - how does the electron gain or give up energy? By absorbing or emitting photons (in the photoelectric effect, an electron absorbs enough energy to jump off the surface of the metal, or be "freed" from the orbit). This has significant results for observations of atoms as we'll see in the next post. For now, though, I'll put up one more diagram, similar to the one above, containing the positively charged nucleus at the center, and an electron that can be in one of three "energy levels" (or floors) by emitting or absorbing a photon (the wavy line). Also, for a little interactive demonstration of the same thing, try this.
Niels Bohr is in many ways the father of quantum physics, if not its prime mover. He came of age before the revolutionary wave of the 1920s, but almost all of the physicists involved in developing quantum mechanics (Heisenberg, Dirac, Pauli to name a few) spent some time at the Institute of Theoretical Physics he founded in 1921. His model of the atom was a precursor to all of the discoveries of quantum physics to follow.
So what is that model? Although it turns out not to be accurate, it's a pretty good start, and I would guess that th
 e Bohr model is generally the picture most of us have in our minds for the atom today. Analogous to our picture of the solar system, the Bohr model imagines a dense, very small nucleus, surrounded by orbiting electrons (I took the picture from a website at Jefferson Lab).
By itself, that isn't all that interesting - the real theoretical interest of the Bohr atom was that the electrons are constrained to lie at specific orbits. In the solar system, the planets could theoretically lie at any radius - we could take the Earth, move it a little farther away from the sun, and it would still orbit contentedly (we might all be a bit colder, but the orbit would be fine). In Bohr's atom, an electron can't move to a slightly larger orbit; instead, it would have to jump to the next available orbit. The analogy is that the Earth can only be at our orbit or Mars' orbit, but nowhere in between.
To take this a step further, we can add energy considerations. The farther away from the nucleus, the more energy an electron has. Therefore, whenever an electron switches orbits, it gives up or takes in energy (depending on whether it's heading out or heading in). If it is only allowed to be in certain orbits, then the possible energy steps are discrete - it can only take in or give up a very specific amount of energy. For one more analogy, suppose my mom is on an elevator on the ground floor. If she goes up in the elevator, she can only get off on floors, she can't get off in between floors. And, as she goes up, she picks up a specific amount of energy (which she could give back if she were to jump out a window - she would be rather more regretful if she jumped out a 4th floor window as opposed to a 1st floor window because of all the energy she picked up by going up the elevator). The electrons in the orbit of the Bohr atom are like my mom on the elevator - they can't get off between floors and the amount of energy they can pick up or give out is discrete and fixed.
The very astute reader might see a similarity between this model and the photoelectric effect of Einstein from a few posts ago, when light could carry a specific and discrete amount of energy depending on its frequency. In fact, this is exactly the same thing - how does the electron gain or give up energy? By absorbing or emitting photons (in the photoelectric effect, an electron absorbs enough energy to jump off the surface of the metal, or be "freed" from the orbit). This has significant results for observations of atoms as we'll see in the next post. For now, though, I'll put up one more diagram, similar to the one above, containing the positively charged nucleus at the center, and an electron that can be in one of three "energy levels" (or floors) by emitting or absorbing a photon (the wavy line). Also, for a little interactive demonstration of the same thing, try this.
 (Courtesy of the Department of Energy)
Subscribe to:
Posts (Atom)
