Friday, August 20, 2010

A little more about me and the blog

I've talked to a few people in the last few weeks who asked me to write a bit more of an introduction to both me and what I'm trying to do with this blog, so here goes:

My parents are both extremely intelligent people. Before he retired, my father was in academic publishing as an editor for several years before running the Princeton University Press for the last 20 years of his career. My mother is a writer, author of several books on a rather wide-ranging list of subjects including gardening, architecture, biographies of several people and two novels. I grew up surrounded by books on history, literature, politics, etc. Despite this rather literary background, however, all through school I somehow found myself doing my best work in math and science. I graduated college with a physics degree, but I did not then know what I wanted to do (nor did I have a job). Fortunately, my thesis advisor in college, Dan McKinsey, was hired as a professor at Yale University that summer and asked me to come work for him while I figured things out. Seven years later, I left Yale with a PhD in physics and I think it's pretty safe to say that I am now trying to make a career as a practicing physicist.

Although my family has gotten used to this idea during the (many) years spent lost in graduate school without a real job, I think it's still a bit of a mystery to them how I ended up as a scientist. And perhaps more importantly, I've often felt that they (and in particular, my mom) really don't know what I do nor how I do it. While the question of how I ended up here is sometimes a mystery to me (as far as I can tell, I like doing the physics I do and figure I should keep at it as long as people let me), the second mystery is something I should be able to do something about, especially if I want to be a good physicist. Hence this blog.

I truly do want to try to explain my work so that my family, and my mom in particular, understands. As I said before, my mom is a very intelligent woman, but she tends to be a touch skittish around mathematical ideas. And if I can explain things like dark matter in an understandable way to her, it will mean that I myself understand what I'm doing. More generally, I've found over the years that people I meet really have a lot of interest in physics, but they always say, “I was no good at it” or even worse, “my teacher was terrible.” In the blog, therefore, I'm trying to write about what I'm doing and why it's interesting in a way that does not require any background while simultaneously not underestimating the audience.

Once I started writing, I quickly discovered the particular format I wanted the blog to take, which I outlined at the bottom of this post: Update and future plans. So that's the summary.

Also, here's a picture of me at my sister's wedding. I'm trying to be funny here.

Thursday, July 29, 2010

Update and future plans

To all three regular readers of this blog,
I apologize for not having posted in several months. By way of explanation, I will say that since April 2, I finished and defended my dissertation, spent a month out of the country, moved to a new city, started a new job and finished it off by watching my sister get married in a beautiful ceremony in Maine. That said, I'm now back and I plan to post more regularly for the foreseeable future.

A giant sun dial in Jaipur, India

To give a little more detail about my new job, I have moved to Chicago to work as a postdoctoral associate at Fermilab, which is the location of the second largest particle accelerator in the world now that the new LHC has turned on at CERN in Switzerland. To a large degree, Fermilab has been the focus of high energy particle physics over the last twenty years, and I'm really excited to be here. Fortunately for all of us, I still plan to work on a dark matter experiment, so I won't have to start on a completely new thread in the blog but instead can pick up where I left off in April.

Let me restate the way I imagine this blog looking - to me, the study of physics builds upon the huge amount of effort and thought that humanity has put into the subject for several hundreds of years (with emphasis on the 20th century). Nothing that we do is a completely new idea, but instead we must draw on all the experiments, theories and results that have gone before. My goal in this blog was to illustrate that idea by starting with a very modern, exciting topic of research like dark matter and showing how each argument that leads us to believe both in its existence and that we might be able to detect it depends on other, more established observations. And then I hoped to explain all of those observations in a more or less simple to understand fashion.

"Standing on the shoulders of giants (taken from mushon)."


As an example, I started with the argument that galaxy rotation curves prove that we are missing something, which of necessity led me to the Doppler effect, light as a wave, Newtonian gravity and back to dark matter. I'm currently trying to explain the Cosmic Microwave Background, which led me to a discussion of thermal equilibrium and then Fourier Analysis, and I'm not quite finished yet.

That is the image I have for this blog, but I'm open to suggestions if I'm failing somewhere or otherwise losing your interest, so please do not hesitate to let me know what you think. And in the next post, I'll get back to physics.

Hugh

Friday, April 2, 2010

Fourier analysis - Sines and integrals (part 3)

We're almost there. Let's talk about two more features of integrals and sine curves. First, (and mom, remember the symbol for "integral" is an s-shaped thing):

∫sin2(x)dx > 0

The integral of the square of the sine function is always positive. This makes sense sort of by definition, because anything squared is always positive, so the negative parts of the sine curve become positive when squared. To illustrate this graphically, I'll show the integral of the sine function:

followed by the integral of the sine squared:

So the integral of the sine times itself is always greater than 0.

Now, the key: the integral of the sine times a sine with a different frequency over an entire period is always equal to 0. Let's slow down and read that one more time, since it's hard to say in a small number of words. The integral of two sine functions with different periods is always 0. To take a specific example, let the second sine function be sin(3x), or one with 3 times the frequency like the green curve here:


The statement I'm making can be expressed symbolically,

∫sin(x)*sin(3x)dx = 0 (integrated over a full period)

How about graphically? Well, here is a plot of sin(x)*sin(3x), and if you look, the green regions are equal in area to the yellow regions, for a total integral of 0.


How about if I show another example, with a sine of four times the frequency.

∫sin(x)*sin(4x)dx = 0 (integrated over a full period)


Again, the areas of the green and yellow regions are equal, and the total integral is 0. Now I haven't proven this is true for all frequencies, but it can be done rigorously (or rigourously); I suppose you might have to take my word on it, but it clearly works for the two examples given.

There's one more theorem that I need to state before finally explaining Fourier analysis, although I hope it won't be too difficult to understand. This is an associative statement, that the integral of the sum of two functions (any functions, let's just call them f(x) and g(x); for example, they could be sin(x) and sin(3x)) is equal to the sum of the integrals done separately:

∫ (f(x) + g(x) )dx = ∫ f(x)dx + ∫ g(x)dx

Let me know if that is not clear, because I'm so excited about the punch line, I'm inclined to skip past some of this stuff.

Finally...


To recap, so far we know the following things:

1. Any periodic shape can be expressed as the sum of sine functions with different frequencies.

2. The integral of a curve is the area under the curve.

3. The integral of a sine times itself is greater than 0.

4. The integral of a sine times a sine with a different frequency is equal to 0.

5. The integral of a sum of functions is equal to the sum of the integrals done independently.

Who can guess what the next step is?

Suppose I have an unknown function (like the A chord from the November post).

By Rule 1, I know that this function can be expressed as the sum of many sine curves of different frequencies. Now, suppose I want to understand what the signal actually is - I want to break it down into the frequencies that went into its construction.

What if I multiplied the unknown function by a sine curve of a given frequency that I know and integrated the result over an entire period? From Rule 4 above, if the frequency I control does not match one of the frequencies that make up the unknown function, the integral will be 0. But if I do find a match, all of a sudden, the integral is positive (by Rule 3) and I've identified one of the component frequencies in my unknown function!

Now, I scan my known frequency over all frequencies, and at the end of the scan, I've found all of the elements that went into making the unknown signal, producing a plot like this:

In this graph, I'm basically plotting the value I get when I integrate the product of the A chord function times a sine with a frequency given by the value on the x-axis. In most situations, I get 0, but when I find a match, the integral (or "power") is positive and I see a spike!

Isn't this exciting? And I'm being completely serious here, none of the vaguely self-mocking tone you might find elsewhere in this blog - I find Fourier analysis completely awesome and elegant and beautiful. Simply using mathematical formalism, we can completely deconstruct a complicated and unknown signal into its individual constituents and understand exactly what is going on. It's stuff like this that makes me love physics and math. If I didn't quite manage to get the beauty and simplicity across in the last few posts, let me know and I'll do what I can to fix it.

Fourier analysis - Sines and Integrals (part 2)

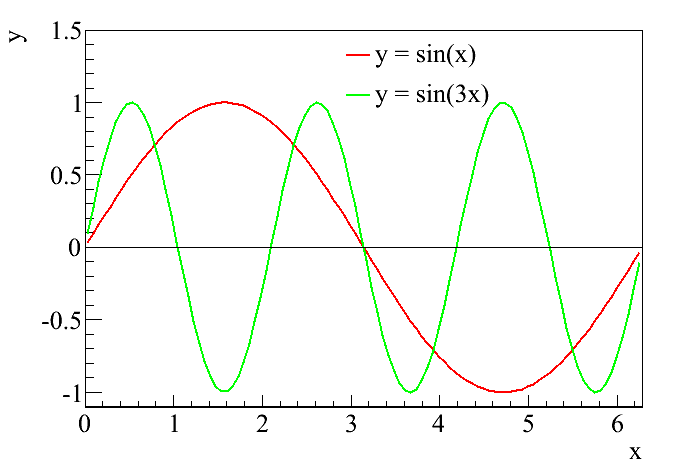
In the last post, I attempted to remind the reader of the definition of a sine curve. I particularly wanted to highlight that the sine function is the mathematical representation of a wave, and since waves are representations of musical notes, a sine curve is also a mathematical representation of a musical note. Those who are familiar with music (or perhaps with my post on the guitar back in November) will be aware that different musical notes are simply waves with different frequencies. That is easily related to the sine curve by multiplying the variable by some number. For example, I've been showing plots of just the basic sine function, y = sin(x) or y = sin(θ). If, however, I decided to plot y = sin(3x), then all of a sudden the frequency of the wave would be tripled, as in this figure:

It is pretty clear that during the time it takes the standard sine function (the red curve) to undergo a full oscillation, the higher frequency curve (the green curve) represented by y = sin(3x) has undergone three full oscillations. Thus, I can represent any of the musical notes using the sine function, simply by changing the multiplication factor. This is essentially what I did in the graphical representations from the November post, by just adding different functions together to produce the sounds I wanted.

We are now ready to talk about the two fundamental keys to Fourier analysis. The first is that any periodic signal can be obtained simply by adding sine curves of different frequencies. To illustrate this, I'm going to draw on everyone's friend, Wikipedia, which has a great entry on Fourier analysis and Fourier series (which does raise the question, "why am I bothering to do this when so many other people have already done it before?" but then this is my blog and I can do it again if I want to. In general, for those who are interested, Wikipedia is really good at mathematical concepts, and I use it as a reference all the time). In the Fourier series article, the unnamed Wikipedia author is exactly illustrating the point I'm making here, that any periodic function can be expressed as the sum of sine curves with different frequencies.

The first example is the square wave. This is a wave that alternates between two values, for example either 1 or -1, so that it looks like a box. The sine function is very smooth, so it may seem hard to believe that you can get a square wave from sines. But, as in the following picture, it doesn't take very many iterations before the sines do a pretty good job at imitating the square wave:


A second example, featuring our favorite gimmick animation, is the the sawtooth wave. Assuming I get this to work right, the animation should show a sawtooth wave along with the sum of sines as each additional sine is added to the total. As with the square wave, the approximation gets pretty good without too many steps:


From here, it should be easy to imagine creating the shapes from my guitar post simply by adding different notes together. The second key will be the subject of the next post.

Friday, February 26, 2010

Fourier analysis - Sines and integrals

In case anyone is still reading this, now that it is being updated so sporadically, I'm finally managing another post on Fourier analysis. In this post, I'll try to set up a little bit of the math behind the theory. To do so, I'm going to first remind everyone about the sine function, which I wrote about when talking about the Double Slit Experiment. In that post, I said that the sine function was a mathematical representation of a wave. Here is a plot of y = sin(θ):
Now, that looks an awful lot like the sound waves I was looking at with my guitar back in November. Because they are the same. In fact, when I wanted to depict the sound waves graphically, I used the sine and its partner, the cosine to do it. Going back to the post on the double slit experiment, I believed I compared these functions to a part of speech; by using them, I can now describe a whole host of different phenomena that were previously inaccessible. Including sound waves.

Next, I want to talk about integrals. My mother never took calculus and says she has no idea what an integral is, which means I'm going to try to give a brief introduction (without going into details, alas). The first thing I was taught about integrals is that they represent the "area under the curve," and I think that's really all we need to know about them. If I draw a curve on a coordinate system, for example, like the sine curve above, then the integral is the area between the curve and the x-axis. Therefore, we need to know one other thing to define it, and that is the range of the integral. For example, I am going to zoom in slightly on that sine curve, and then I'll take the integral from x = 0.5 to x = 2.5, which is just the area below the curve between those limits, or the region shaded green.


Now, things can get a bit trickier conceptually when the curve crosses the x-axis and becomes negative-valued. In this case, the integral is still the area under the curve, except that it is now negative. This is represented by the yellow shading.


Finally, if you look carefully, you'll notice that the sine function appears to be symmetric. This will be really important for Fourier analysis. If you integrate the sign function over an entire period, the positive part and the negative part cancel each other out, and we're left with a total integral of 0.


I want to make two final comments about integrals. The key to calculus is finding out that you can generally solve for these areas if you know the functional form of the curve (in this case, for example, we know the curve is a sine curve, so I could write down the function representing the area from calculus). And because I know this is the kind of thing that might interest my mom, in math, we represent an integral with a symbol that looks a little bit like an "S". For example, the integral of sin(x) is written like this:

∫sin(x)dx

The "dx" is there partly to let the reader know that the integral is being performed over the x variable.

Friday, January 22, 2010

Carl Wieman and learning science

This will be the second non-Fourier post I will write, and again I apologize. Who knew that writing a thesis and applying for jobs was so demanding? The subject of this post is learning and teaching science. This week, we had Nobel Laureate Carl Wieman visiting Yale, and he gave two great talks on research people have done on how students actually learn science. Professor Wieman has been applying scientific methods to scientific learning for some time now, and among other things, he writes a blog about it.

One of the more interesting conclusions is that the standard lecture format of undergraduate courses is poorly matched to the way people actually learn and retain scientific understanding - in fact, often students come out of these classes thinking more like a "novice" scientist than when they started. By novice, I mean the following: there are certain ways that an expert in a scientific field thinks about that field that are very different from the way a novice thinks about that field. For example, a novice believes that scientific content consists of isolated pieces of information that have been handed down by some authority and require memorization. An expert believes that scientific content consists of a coherent structure of concepts that build on each other, being accurate descriptions of nature and established by experiment. Sad to say, but students coming out of intro science classes are even more likely to believe that science is bits of memorization based on nothing more than faith, as opposed to a coherent argument based on reality.

These results resonated with me, because in this blog, I've tried to emphasize how one builds to a conclusion (like "dark matter exists") from a variety of physical observations and theories (like the 20 posts that followed my original three). I'm sure that sometimes (often?) I fail in communicating this key point about the way I look at physics, but that is ultimately the goal of this blog. And when I start writing it again regularly, I'll try not to forget that.

Finally, Wieman and his group have developed a series of simulations for students to play with that really demonstrate key concepts of physics. One example that caught my eye is something that I tried to explain in a post a few months ago, the photoelectric effect. If a reader really wants to understand what I was trying to say in that post, I highly recommend trying out Wieman's simulation, located here. Especially you, mom (although she's currently in India right now, and therefore not reading this blog at all. By the time she gets back, I'll be writing more regularly...)

Thursday, December 24, 2009

The CDMS result

Merry Christmas, everyone. I know I promised more on Fourier analysis, and I'll get to it, but I want to take a slight detour to mention some exciting results announced last week by the Cryogenic Dark Matter Search (CDMS), a dark matter experiment based on a different technology than my own. For the last decade, CDMS has been the leading experiment in the field, and their new result is no different. A week ago, CDMS released the results of their most recent analysis, and lo and behold! they had some events. This is exciting.

Before going forward, I'll just mention the methodology at work here. With some notable exceptions (like DAMA, for example), most dark matter experiments work by pushing down the backgrounds as much as possible to reveal the dark matter signal that may or may not be there. Therefore, the majority of work goes into understanding exactly how much background might be left over, with the goal to have "zero" background during the time the experiment is looking for WIMPs. It is generally impossible to have "zero" background - what is possible is a very small fractional expectation of a background. For example, CDMS expected 0.6 background events in their data set. What that means is they studied all possible sources of background using calibration sources and simulations and estimated that in the amount of time they looked for dark matter, on average they would see 0.6 background events.

When they looked at their data, they found 2 events. One can calculate the probability of having 2 background events given an expectation of 0.6, and CDMS has done this; they determined that there was about a 25% chance that the two events could be a fluctuation on the background, leaving a 75% chance that the 2 events were something new, like a dark matter interaction. This is not enough significance to claim a discovery (most physics experiments require a measurement with over a 99.999% chance of being something new before a discovery can be claimed), but it is exciting. Up until now, most experiments have never claimed to see something over background, so these results are a sign that there might actually be something to the last five years of my life. Of course, it's always possible CDMS underestimated their backgrounds.

As mentioned in the NYTimes article, we'll now wait with bated breath for the results from XENON100 in Italy, which should be the next experiment to get results. If the 2 events in the CDMS data are real dark matter events, XENON100 should be able to find out. And then my experiment should follow that up with our own search in a year or two. It's a good time to be involved in dark matter - who knows, maybe we'll figure out one of the biggest mysteries in physics from the last 70 years before the next presidential election.