Showing posts with label sine function. Show all posts

Friday, April 2, 2010

Fourier analysis - Sines and integrals (part 3)

We're almost there. Let's talk about two more features of integrals and sine curves. First, (and mom, remember the symbol for "integral" is an s-shaped thing):

∫sin2(x)dx > 0

The integral of the square of the sine function is always positive. This makes sense sort of by definition, because anything squared is always positive, so the negative parts of the sine curve become positive when squared. To illustrate this graphically, I'll show the integral of the sine function:

followed by the integral of the sine squared:

So the integral of the sine times itself is always greater than 0.

Now, the key: the integral of the sine times a sine with a different frequency over an entire period is always equal to 0. Let's slow down and read that one more time, since it's hard to say in a small number of words. The integral of two sine functions with different periods is always 0. To take a specific example, let the second sine function be sin(3x), or one with 3 times the frequency like the green curve here:


The statement I'm making can be expressed symbolically,

∫sin(x)*sin(3x)dx = 0 (integrated over a full period)

How about graphically? Well, here is a plot of sin(x)*sin(3x), and if you look, the green regions are equal in area to the yellow regions, for a total integral of 0.


How about if I show another example, with a sine of four times the frequency.

∫sin(x)*sin(4x)dx = 0 (integrated over a full period)


Again, the areas of the green and yellow regions are equal, and the total integral is 0. Now I haven't proven this is true for all frequencies, but it can be done rigorously (or rigourously); I suppose you might have to take my word on it, but it clearly works for the two examples given.

There's one more theorem that I need to state before finally explaining Fourier analysis, although I hope it won't be too difficult to understand. This is an associative statement, that the integral of the sum of two functions (any functions, let's just call them f(x) and g(x); for example, they could be sin(x) and sin(3x)) is equal to the sum of the integrals done separately:

∫ (f(x) + g(x) )dx = ∫ f(x)dx + ∫ g(x)dx

Let me know if that is not clear, because I'm so excited about the punch line, I'm inclined to skip past some of this stuff.

Finally...


To recap, so far we know the following things:

1. Any periodic shape can be expressed as the sum of sine functions with different frequencies.

2. The integral of a curve is the area under the curve.

3. The integral of a sine times itself is greater than 0.

4. The integral of a sine times a sine with a different frequency is equal to 0.

5. The integral of a sum of functions is equal to the sum of the integrals done independently.

Who can guess what the next step is?

Suppose I have an unknown function (like the A chord from the November post).

By Rule 1, I know that this function can be expressed as the sum of many sine curves of different frequencies. Now, suppose I want to understand what the signal actually is - I want to break it down into the frequencies that went into its construction.

What if I multiplied the unknown function by a sine curve of a given frequency that I know and integrated the result over an entire period? From Rule 4 above, if the frequency I control does not match one of the frequencies that make up the unknown function, the integral will be 0. But if I do find a match, all of a sudden, the integral is positive (by Rule 3) and I've identified one of the component frequencies in my unknown function!

Now, I scan my known frequency over all frequencies, and at the end of the scan, I've found all of the elements that went into making the unknown signal, producing a plot like this:

In this graph, I'm basically plotting the value I get when I integrate the product of the A chord function times a sine with a frequency given by the value on the x-axis. In most situations, I get 0, but when I find a match, the integral (or "power") is positive and I see a spike!

Isn't this exciting? And I'm being completely serious here, none of the vaguely self-mocking tone you might find elsewhere in this blog - I find Fourier analysis completely awesome and elegant and beautiful. Simply using mathematical formalism, we can completely deconstruct a complicated and unknown signal into its individual constituents and understand exactly what is going on. It's stuff like this that makes me love physics and math. If I didn't quite manage to get the beauty and simplicity across in the last few posts, let me know and I'll do what I can to fix it.

Fourier analysis - Sines and Integrals (part 2)

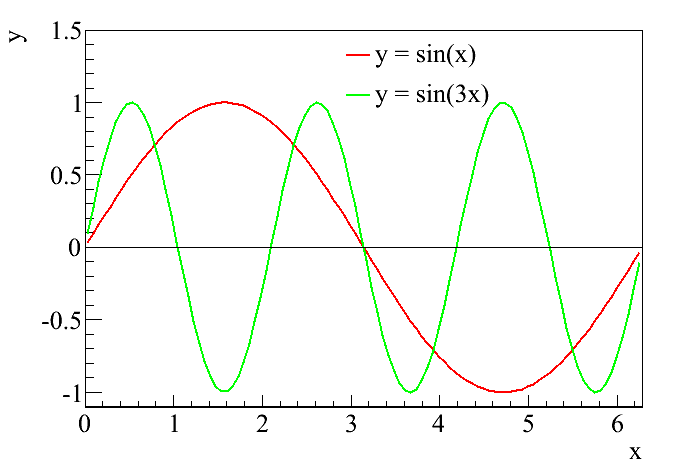
In the last post, I attempted to remind the reader of the definition of a sine curve. I particularly wanted to highlight that the sine function is the mathematical representation of a wave, and since waves are representations of musical notes, a sine curve is also a mathematical representation of a musical note. Those who are familiar with music (or perhaps with my post on the guitar back in November) will be aware that different musical notes are simply waves with different frequencies. That is easily related to the sine curve by multiplying the variable by some number. For example, I've been showing plots of just the basic sine function, y = sin(x) or y = sin(θ). If, however, I decided to plot y = sin(3x), then all of a sudden the frequency of the wave would be tripled, as in this figure:

It is pretty clear that during the time it takes the standard sine function (the red curve) to undergo a full oscillation, the higher frequency curve (the green curve) represented by y = sin(3x) has undergone three full oscillations. Thus, I can represent any of the musical notes using the sine function, simply by changing the multiplication factor. This is essentially what I did in the graphical representations from the November post, by just adding different functions together to produce the sounds I wanted.

We are now ready to talk about the two fundamental keys to Fourier analysis. The first is that any periodic signal can be obtained simply by adding sine curves of different frequencies. To illustrate this, I'm going to draw on everyone's friend, Wikipedia, which has a great entry on Fourier analysis and Fourier series (which does raise the question, "why am I bothering to do this when so many other people have already done it before?" but then this is my blog and I can do it again if I want to. In general, for those who are interested, Wikipedia is really good at mathematical concepts, and I use it as a reference all the time). In the Fourier series article, the unnamed Wikipedia author is exactly illustrating the point I'm making here, that any periodic function can be expressed as the sum of sine curves with different frequencies.

The first example is the square wave. This is a wave that alternates between two values, for example either 1 or -1, so that it looks like a box. The sine function is very smooth, so it may seem hard to believe that you can get a square wave from sines. But, as in the following picture, it doesn't take very many iterations before the sines do a pretty good job at imitating the square wave:


A second example, featuring our favorite gimmick animation, is the the sawtooth wave. Assuming I get this to work right, the animation should show a sawtooth wave along with the sum of sines as each additional sine is added to the total. As with the square wave, the approximation gets pretty good without too many steps:


From here, it should be easy to imagine creating the shapes from my guitar post simply by adding different notes together. The second key will be the subject of the next post.

Friday, February 26, 2010

Fourier analysis - Sines and integrals

In case anyone is still reading this, now that it is being updated so sporadically, I'm finally managing another post on Fourier analysis. In this post, I'll try to set up a little bit of the math behind the theory. To do so, I'm going to first remind everyone about the sine function, which I wrote about when talking about the Double Slit Experiment. In that post, I said that the sine function was a mathematical representation of a wave. Here is a plot of y = sin(θ):
Now, that looks an awful lot like the sound waves I was looking at with my guitar back in November. Because they are the same. In fact, when I wanted to depict the sound waves graphically, I used the sine and its partner, the cosine to do it. Going back to the post on the double slit experiment, I believed I compared these functions to a part of speech; by using them, I can now describe a whole host of different phenomena that were previously inaccessible. Including sound waves.

Next, I want to talk about integrals. My mother never took calculus and says she has no idea what an integral is, which means I'm going to try to give a brief introduction (without going into details, alas). The first thing I was taught about integrals is that they represent the "area under the curve," and I think that's really all we need to know about them. If I draw a curve on a coordinate system, for example, like the sine curve above, then the integral is the area between the curve and the x-axis. Therefore, we need to know one other thing to define it, and that is the range of the integral. For example, I am going to zoom in slightly on that sine curve, and then I'll take the integral from x = 0.5 to x = 2.5, which is just the area below the curve between those limits, or the region shaded green.


Now, things can get a bit trickier conceptually when the curve crosses the x-axis and becomes negative-valued. In this case, the integral is still the area under the curve, except that it is now negative. This is represented by the yellow shading.


Finally, if you look carefully, you'll notice that the sine function appears to be symmetric. This will be really important for Fourier analysis. If you integrate the sign function over an entire period, the positive part and the negative part cancel each other out, and we're left with a total integral of 0.


I want to make two final comments about integrals. The key to calculus is finding out that you can generally solve for these areas if you know the functional form of the curve (in this case, for example, we know the curve is a sine curve, so I could write down the function representing the area from calculus). And because I know this is the kind of thing that might interest my mom, in math, we represent an integral with a symbol that looks a little bit like an "S". For example, the integral of sin(x) is written like this:

∫sin(x)dx

The "dx" is there partly to let the reader know that the integral is being performed over the x variable.

Friday, March 27, 2009

The Double-Slit Experiment (quantitative) - Part 2


(click on the picture for a larger view)

Now that we know what a sine wave is, we can understand the double-slit experiment. I need to start with a few definitions that I probably should have put in the last post: the wavelength is the length between two successive peaks in the wave (often represented by λ) and the amplitude is the height of the wave (we'll call it A). There is a symmetry property of the wave; if you shifted the wave to the right or left by its wavelength, it would look exactly the same. In fact, you could shift the wave by any integer times the wavelength, and you wouldn't be able to tell the difference. This will be important later on.

To understand the double slit experiment, we need to ask what happens when two waves overlap. The answer depends on their "phase," or where each wave is in its oscillation relative to the other. For example, suppose two waves are perfectly "in phase," so that when one wave is peaking, so is the other. When you add these two waves together, you'll get a wave that is twice as big in amplitude.


What about when the waves are "out of phase" so that one is all the way up when the other is all the way down? In that case, the waves destructively interfere so that the addition contains no wave at all.


This interference is the key to the double-slit experiment and allows us to predict the shape of the light pattern on the screen. When the light impinges on the slit, the waves that come come out the other side are initially in phase. If you look at the the screen directly across from the slit, you would see a dark spot. However, that bright spot will be banded by bright spots, which will in turn be banded by two more dark spots in a fringe pattern. To understand why, let's zoom in on the slit right where the light passes through (on this lovely diagram I stole from here).


Here, the distance between the slit and the wall is L and the slit separation is d. Where on the wall do you expect to see bright or dark spots? If we want there to be a bright spot on the wall, then we know the two waves must interfere constructively (the first case discussed above) or be in phase. A dark spot will appear when the waves are out of phase and interfere destructively. Let θ (again, angles are always θs) be the angle between the horizontal and the position of a given fringe on the wall). If we look high on the wall, the light that came out of the top slit doesn't have to go as far as the light that came out of the bottom slit (in other words, r1 is bigger than r2). This means that the bottom ray of light will have more time to trace out its wavelength and will drop out of phase with the top ray of light. The extra distance traveled by the bottom ray is equal to d*sin θ (remember that the sine function also related the sides of a triangle and notice that the light paths r1 and r2 form a triangle with the slit). Now, remember the symmetry of the wave - a wave that is shifted by its wavelength looks the same. So if the extra distance traveled by the bottom wave equaled exactly its wavelength, it would look identical to the top wave, and the waves would interefere constructively - a bright spot would appear on the wall. If, on the other hand, the extra distance traveled was exactly half a wavelength, so that the bottom wave had just enough time to get out of phase, the two waves would interfere destructively and a dark spot would appear on the wall.

This is exactly what happens - bright spots appear if d*sin θ = λ or some multiple of λ, while dark spots appear if d*sin θ = λ/2. Wave properties predict exactly the patterns that appear in the double-slit experiment, confirming that light is like a wave.

Sunday, March 22, 2009

The Double-Slit Experiment (quantitative) - Part 1

I want to try and explain some of the math behind the double-slit experiment discussed in the last post. The goal here is not to explain the weird nature of light mathematically, which is beyond the scope of a blog. I do want to show how the double-slit experiment proves light behaves as a wave quantitatively and give an example of how math can be used to explain the results of an experiment.

After a brief discussion with my mom, I realize that I will have to start by explaining what the sine function is (hence the "Part 1" in the title. For the reader who knows what the sine function is, I apologize. Hopefully you will enjoy this post anyway [I always like reading about something I know, it's egotistically gratifying and maybe there will be some interest to be found here from a pedagogical standpoint]). From looking at some of the comments, I fear that just the mention of something called a sine function will cause eyes to glaze over, so let me try and explain why I think it's cool. Math is a language, and each additional element in the language expands the scope of what you can talk about. For example, English with just nouns and verbs would be a boring language ("I wrote"). This is like math with just multiplication. But when you include adverbs and adjectives, all of a sudden you can say something interesting ("I wrote a fascinating post on math, and everyone unanimously agreed that I was the best blogger around who specializes in explaining physics to his mother."). In math, it's the same way; the sine function is a tool that enables a discussion of a whole host of things that were previously unavailable, and in particular, waves.

Let's start with a circle like the one shown and draw a line from the center of the circle to the edge. I'm going to trace out the circumference of the circle with this line. At any one time, the angle between that line and the horizontal axis is θ (my mom will ask about the variable names again, for whatever reason angles are always given Greek letters, and θ is always the first one given), and the projection of that line on the horizontal and vertical axes are x and y respectively. I'm particularly interested in the vertical projection, y (hence the color). Initially, when θ=0, the line is entirely horizontal, and y=0. As θ increases, then so does y, until reaching its maximum value when the line is entirely in the vertical axis. Then y decreases before reaching 0 again, and then goes negative, before finally returning to where it started. We can imagine going around the circle again and getting the exact same thing.


Now plot y as a function of θ, and we get a wave.
This is the sine function - or more technically, the ratio of y to the radius of the circle (we could have performed a similar exercise for the x coordinate and obtained the cosine function, which is [clearly] a very close relative of the sine). It describes a wave as well as circular motion. It also represents a relationship between the sides of a triangle (the alert reader will have noticed that x, y and the radius created a triangle for each angle, suggesting that the sine of an angle relates the length of the sides of a triangle to the hypotenuse). Among many other things. All in all, it's really useful.